When you run an online business, it can be very easy to get caught up wondering which business analytics actually matter.
Is it your social media follower numbers? Your total website traffic each day/week/month? How much money you make every minute of every hour of every day?

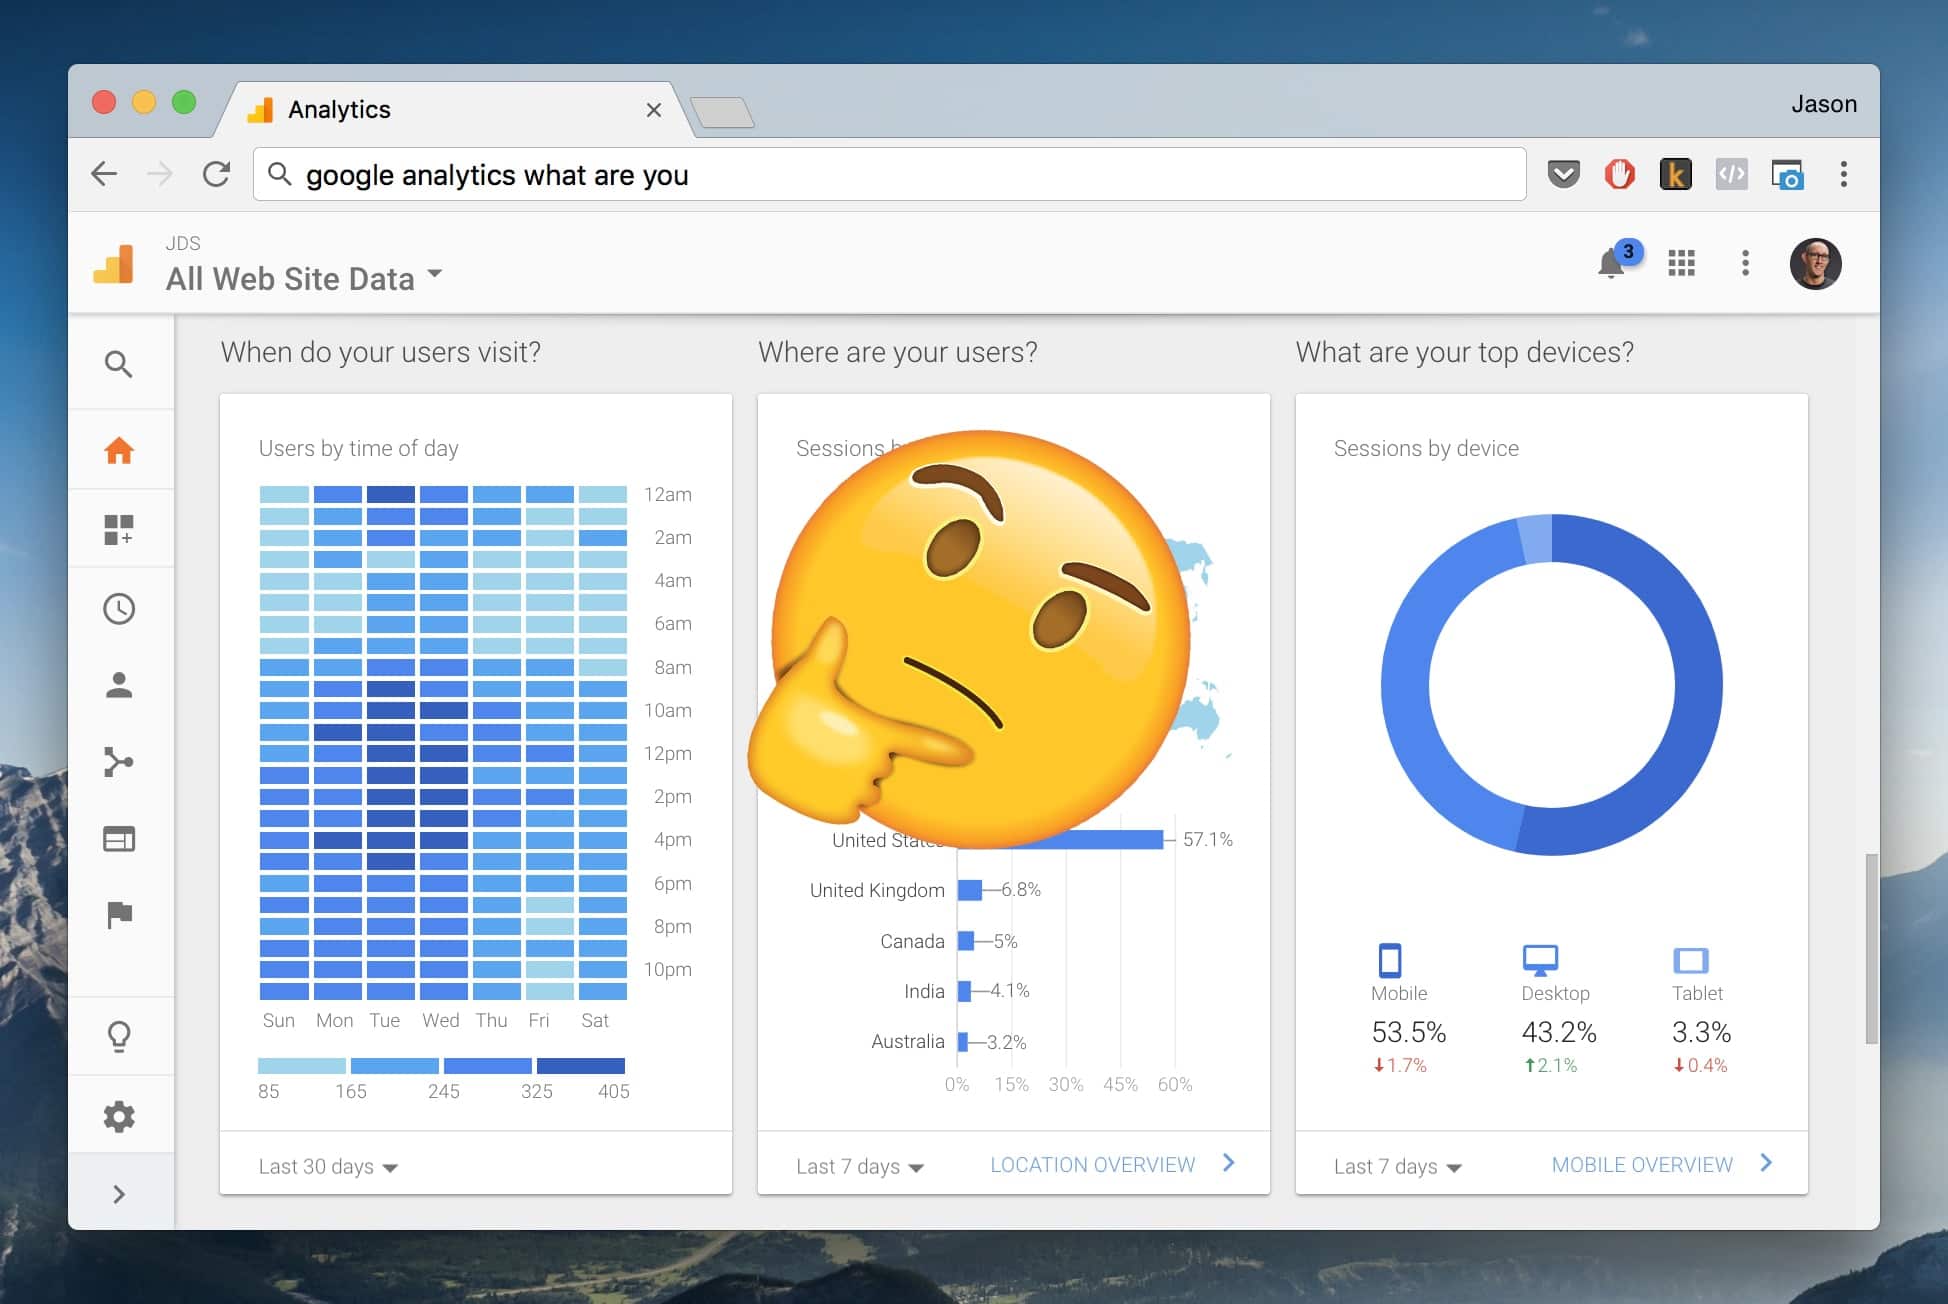
(Oh Google Analytics, I want to love you. I really do.)
With nearly a decade of online business experience, I’d like to share my perspective on the analytics you should be paying attention to. Spoiler alert: None of them will have to do with your social media accounts.
Before we begin, let’s discuss what I’m talking about when it comes to running an online business…
Website – You have a website for whatever it is that you sell. This website should be getting traffic from multiple sources (direct, organic, social, etc).
Product – You have a product (or service) that you sell on your website. It could be a widget, a gizmo, a gadget, or even rare golden thimbles. Seriously though, you sell something for money on your website that people can purchase (via credit card, PayPal, etc).
Subscribers – You have people who purchase things from you and people who just want to get email updates from you. For sake of simplicity, let’s group them together and refer to them as subscribers (and you can segment them later, if you’re into that sort of thing).
Those three items (website, product, subscribers) are what make your business run. There’s typically a direct cause and effect between each:
- Your website gets traffic, putting more eyeballs on your product(s).
- Your product(s) get purchased or people sign up to learn more.
- Your subscribers continue to buy from you or get messages from you.
This loop happens over and over again. You’ve probably experienced this loop in a varying degree of sizes. Sometimes you have traffic spikes, which lead to spikes in sales – Yay! Sometimes you have slow times, which lead to you wanting to pull your hair out and wondering if everything you do should be completely flipped upside and you should go back to that full-time job you used to have – BOO! (don’t do that!) Either way, your online business revolves around traffic, subscribers, and revenue.
The Business Analytics That Should Matter To You: Website Traffic, Email Subscribers, And Revenue
This may not seem like news to you, but for many online business owners, myself included, the data that really matters lies in between each of those main analytics (traffic, subscribers, revenue).
Important In Between Data Point #1 – Do you know your traffic to subscriber conversion rate?
If you don’t, that’s okay! Traffic to subscriber conversion rate is simply the percentage of visitors to your website that sign up for your email list.
Why traffic to subscriber conversion rate matters: Whatever traffic you have coming to your website, you want to capture it and keep the attention of those subscribers (remember: these people purchase from you or pay attention to you). If someone simply visits your website, looks around, and leaves without doing anything, you’ve potentially lost that person forever. Instead, because you’re running a business here, you want them to purchase something from you or at least opt-in to hear from you in their email inbox.
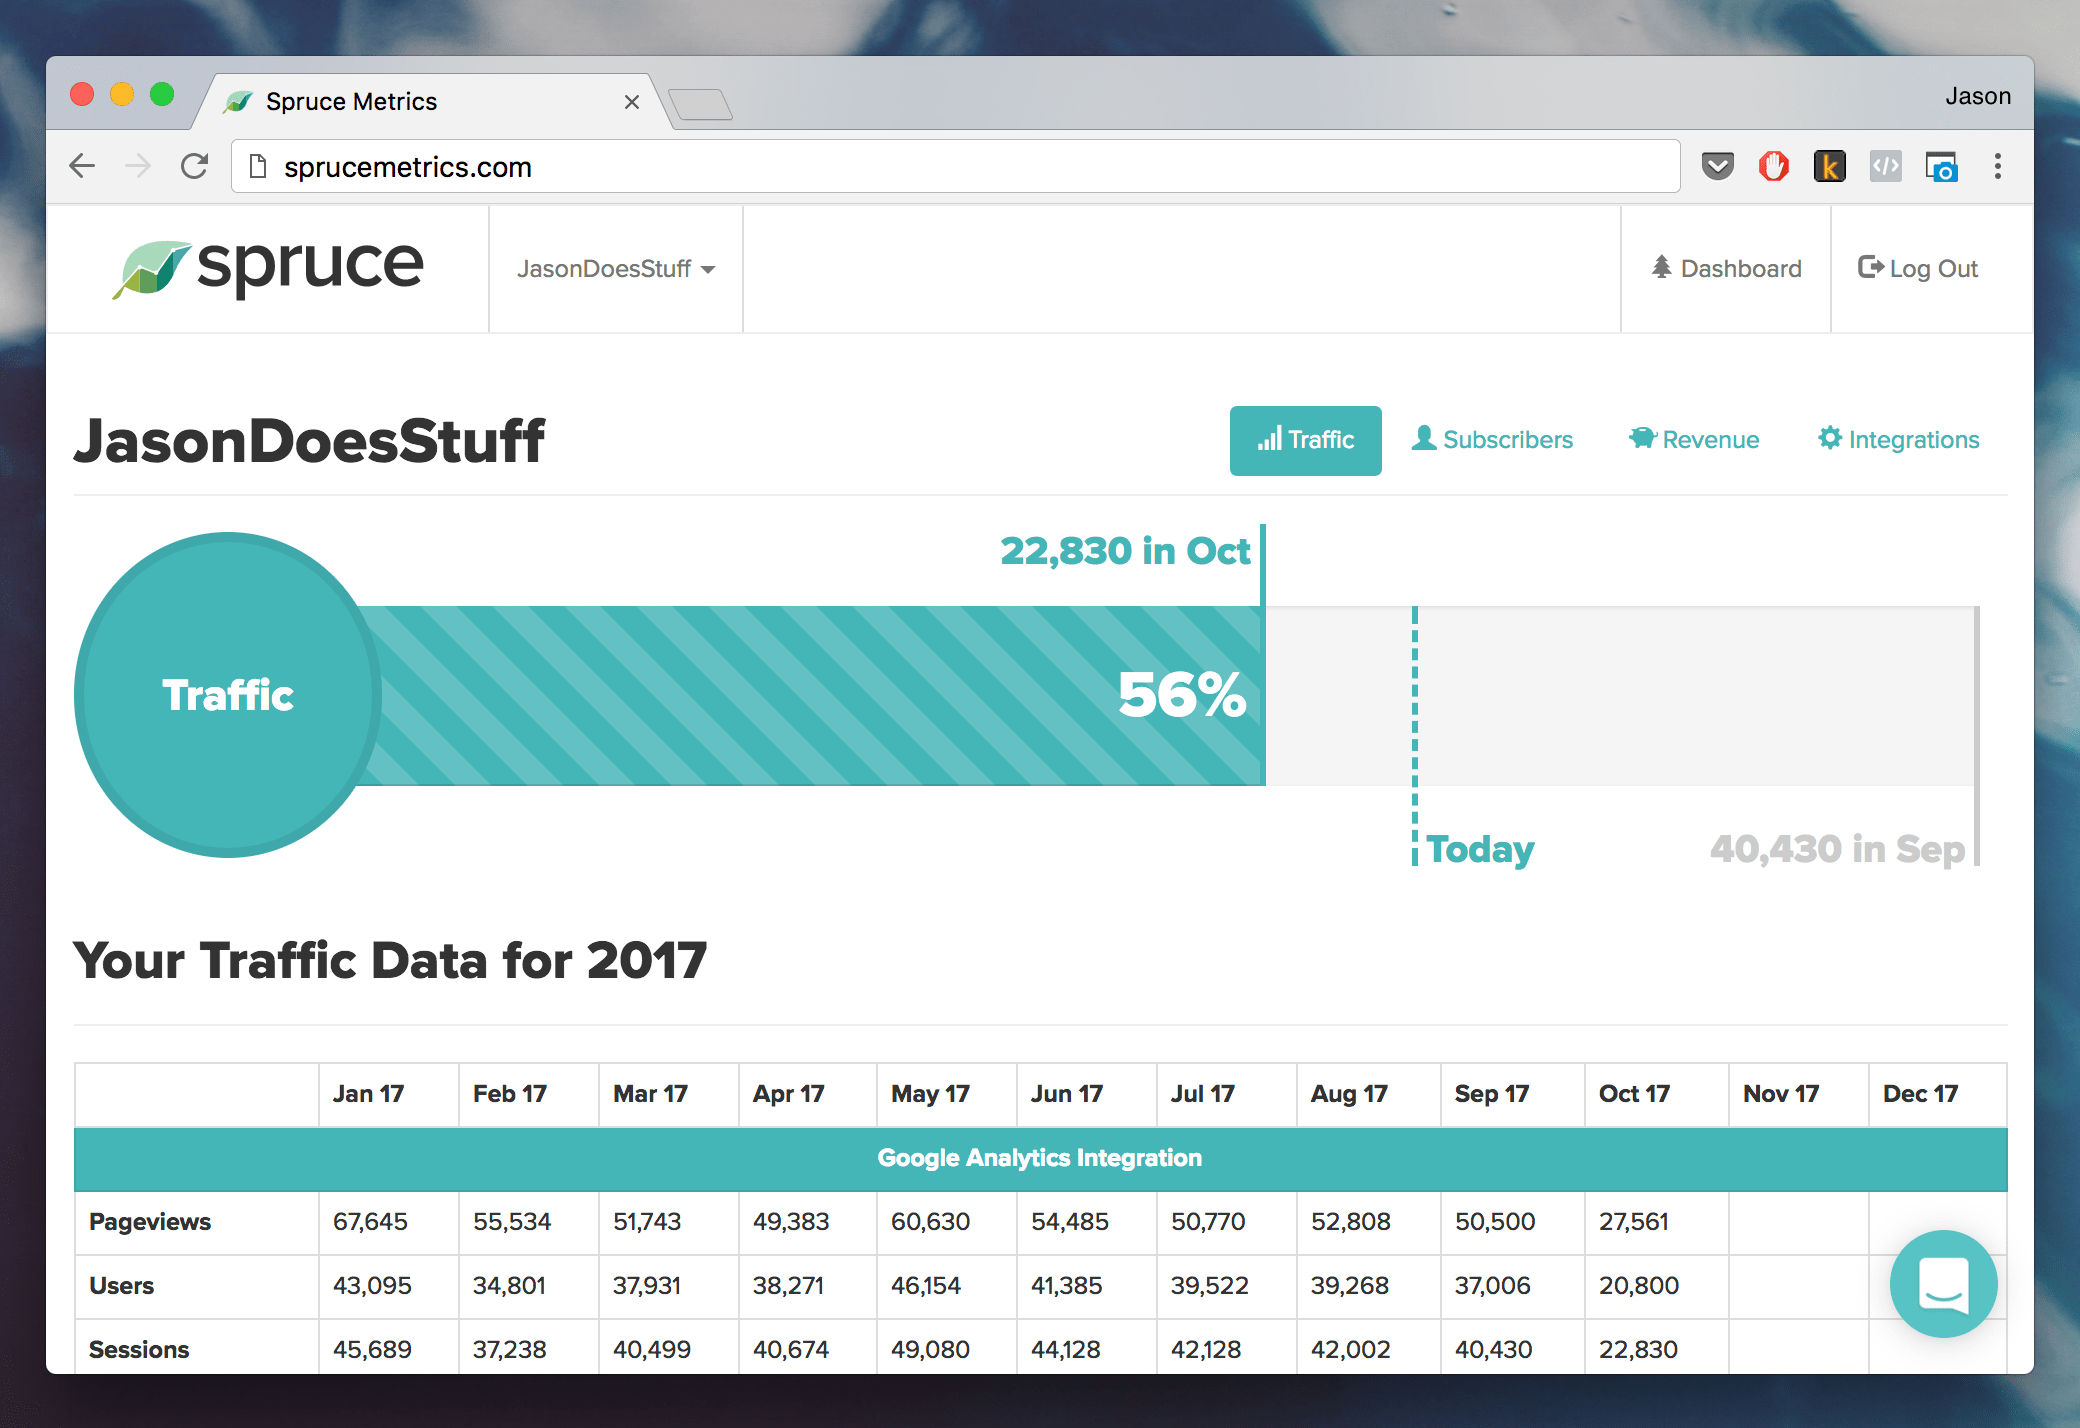
Let’s look at example data for my previous website JasonDoesStuff.com:

(This screenshot is from Spruce Metrics, a business analytics software I co-own and that I’ll talk more about in a moment.)
There are a handful of numbers to look at there, but I’ve highlighted the conversion rate in red for you (you’re welcome!) The month of traffic you’re looking at had 42,002 sessions* (website traffic) on JasonDoesStuff. From those sessions 3,714 people became new subscribers.
Therefore, JasonDoesStuff converted 8.84% of website traffic into subscribers that month.
*We choose “sessions” as our traffic data point of choice because people who are smarter than me agree it’s the most comprehensive way to track a website visitor.
What’s a good traffic to subscriber conversion rate to shoot for? We could go down a rabbit hole discussing what optimal traffic to subscriber conversion rate is, but what’s most important is that you actually KNOW this statistic exists. It shows you how good of a job you’re doing converting a website visitor to an email subscriber. Once you know this data point, then you can start to make tweaks to improve it.
How can you improve your traffic to subscriber conversion rate? Ahhh, great question! There are a ton of things you can change on your website to increase your conversion, but here are the ones I’d propose starting with right away:
- Look at the three highest trafficked pages of your website. Do they all have an email signup form prominently placed on the page? If not, get on that.
- Explain the value a potential subscriber gets if they give you their email address. Do NOT just say “sign up for updates” or “get on my list.” Don’t do that. Explain the value of what you’ll send them and how it can help them.
- I absolutely love my honest Welcome Mat on JasonDoesStuff. It’s just like a welcome mat you might put at the front door of your home.

I ran a 3-week experiment where I tested a website pop-up (left), Welcome Mat (right), or exit intent pop-up. I wanted to see which option my website visitors preferred. You already know the answer, but you can read more here.
Important In Between Data Point #2 – Do you know the value of your subscribers?
These are people who can pay you in attention (just subscribing and opening your emails), but again, you’re running a business and you need revenue to survive. We want your subscribers to become paying customers.
It can be a bit tricky to calculate the value of your subscribers, but even knowing the estimated value is incredibly helpful.
How do you calculate the estimated value of your subscribers? For nice round numbers, I’m going to show you how to do this annually.
Let’s assume your business generates $50,000 in revenue each year and you have 2,000 total email subscribers during that year. You’d divide 50,000 by 2,000 to get the estimated value of $4 per subscriber.
This is a great piece of data to know because it can show you how your revenue should grow as your amount of subscribers grows (either organically or through paid acquisition).
What do I do once I know the estimated value of a subscriber? Assuming our example subscriber value of $4/per, you can acquire new subscribers at a cost of $3/per (leaving $1 per to make a decent profit). If your subscriber value is much lower, let’s say $0.25/per, you are going to need to have a pretty sizable email list to run a profitable business. A lower value per subscriber would tell me that I need to:
- Potentially raise the price of my product(s)
- Improve my sales strategy to get more subscribers to purchase
- Have additional products my customers can buy
Many online business owners focus on customer acquisition over customer retention. If someone has already paid you (remember: with their attention or by purchasing a product), you should do everything in your power to increase their value* to your business.
*I’m not telling you to hard sell and constantly be pitching your subscribers to buy from you, but you may not be selling enough.
Here are two other business metrics you should keep an eye on…
#1 Subscriber Growth Rate
It can become easy to obsess over how many people subscribe and unsubscribe from your email list. You may know how many new subscribers you get each month (or maybe not), but most email service providers don’t show you monthly growth rate.
Subscriber Growth Rate is your percentage change in total subscribers month over month. Here’s an example of that data, highlighted in red:

You can see in the image above my friend Matt’s Subscriber Growth Rate. He figured out the wonderful combination of acquiring more new subscribers AND lowering his monthly unsubscribes.
If your subscriber growth rate is decreasing and you think it might be due to high unsubscribes, here are a couple things you can try:
- On your email signup forms make it clearer of what a subscriber should expect to get from you if they subscribe.
- Send consistent content to your subscribers. If you’re just showing up in their inbox every couple months, a subscriber might forget why they joined at all.
- Make your welcome email amazing. This first email someone gets right after subscribing will have the highest open rate of ANY email you send (ever). Add some surprise and delight to this email to create a stronger trust factor with your subscribers.
#2 Refund Percentage
This one may be obvious, but many commerce platforms don’t clearly show you what percentage of your sales get refunded. Refund percentage is easy to calculate: Just take the total numbers of refunds divided by total number of purchases.
For example: Let’s say you had 9 refunds on 90 purchases. Your refund percentage is 10%.
To me, 10% is a high refund percentage. Something isn’t connecting between the sales pitch of your product and what the product actually delivers. You can improve your refund percentage by doing a couple things:
- Ask people who’ve refunded their purchase why they refunded. Was it the quality? Did the product not meet their expectations? Did they expect one thing and get something completely different? This feedback is critical and should be taken often.
- Under promising and over delivering. When someone purchases a product from you, have something unexpected come with it. That doesn’t have to be another product (but it could be). It might be a personalized video from you, a guide to getting the most out of the product, or a well crafted thank you email…

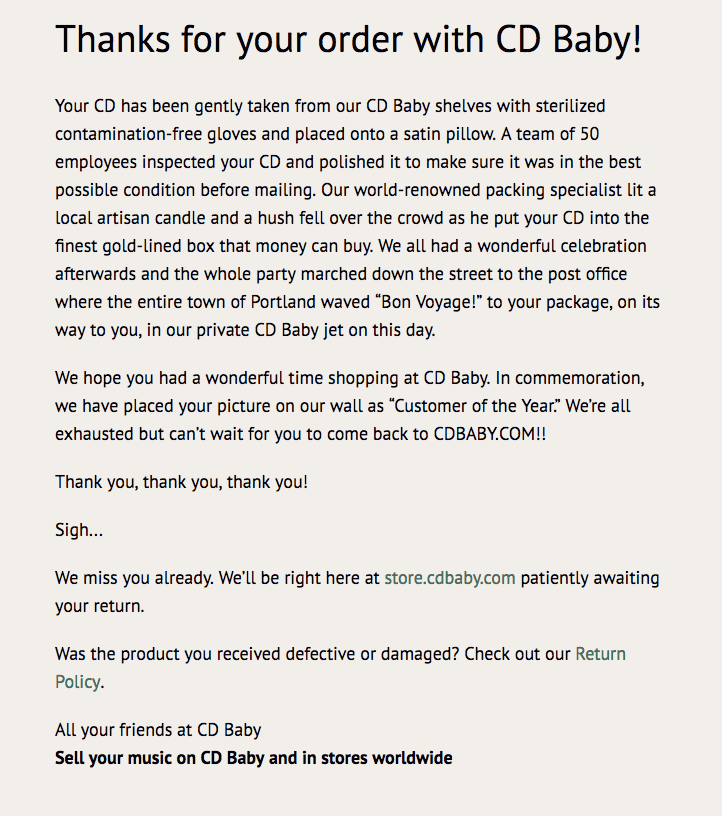
(This is a pretty famous post-purchase email that Derek Sivers used for his company CD Baby. It’s been shared everywhere and customers loved this little surprise after a purchase. This simple email actually become a huge piece of marketing and retention!)
The Only Analytics You Should Care About
The analytics you should be paying attention to for your online business are:
- Traffic to subscriber conversion percentage
- Revenue per subscriber
- Subscriber growth rate
- Refund percentage
These data points are critically important and can be heavily improved through a handful of things mentioned in this article. Before you try to improve them, you probably want to make sure you’re calculating them and can see them in an ongoing basis!
If you’re overwhelmed by keeping track of all your business metrics and wish you could see them all in one place, give Spruce Metrics ($19/mo) a try!
Spruce Metrics is a piece of software I co-founded and it will help bring your website traffic, email subscribers, and revenue together. Then, we crunch that data for you and show you some of the data points I’ve talked about here (revenue per subscriber is coming soon).
If you want to monitor the business analytics that matter and see it all in one simple dashboard, that’s what we built Spruce Metrics for.
You can stop looking at Google Analytics every day. It’s time you started paying attention to the metrics that are actually going to grow your biz 👍🏻.


